|
|
|
|
|
|
Part 1: Background: Hong Kong Flu
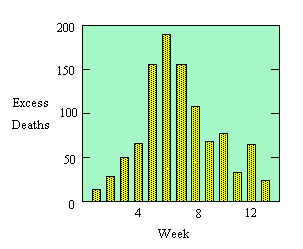
During the winter of 1968-1969, the United States was swept by a virulent new strain of influenza, named Hong Kong flu for its place of discovery. At that time, no flu vaccine was available, so many more people were infected than would be the case today. We will study the spread of the disease through a single urban population, that of New York City. The data displayed in the following table are weekly totals of "excess" pneumonia-influenza deaths, that is, the numbers of such deaths in excess of the average numbers to be expected from other sources. The graph displays the same data. (Source: Centers for Disease Control.)
|
 |
Relatively few flu sufferers die from the disease or its complications, even without a vaccine. However, we may reasonably assume that the number of excess deaths in a week was proportional to the number of new cases of flu in some earlier week, say, three weeks earlier. Thus the figures in the table reflect (proportionally) the rise and subsequent decline in the number of new cases of Hong Kong flu. We will model the spread of such a disease so that we can predict what might happen with similar epidemics in the future.
At any given time during a flu epidemic, we want to know the number of people who are infected. We also want to know the number who have been infected and have recovered, because these people now have an immunity to the disease. (As a matter of convenience, we include in the recovered group the relative handful who do not recover but die -- they too can no longer contract the disease.) If we ignore movement into and out of the infected area, then the remainder of the population is still susceptible to the disease. Thus, at any time, the fixed total population (approximately 7,900,000 in the case of New York City in the late 1960's) may be divided into three distinct groups:
In the next part, we will investigate a simple model that accounts for a few of the features of the spread of a disease such as the Hong Kong Flu.
|
|
|
| modules at math.duke.edu | Copyright CCP and the author(s), 2000 |