Time and Temperature
Part 1: Background
In this module we study
cyclic phenomena in our natural environment, and we explore the extent
to which we can model these phenomena by trigonometric functions.
As an example, we start
with sunrise and sunset data, which may be found in abundance on a web
page at the U.
S. Naval Observatory. Specifically, you can enter any location in the
U. S. and any year, and the USNO site will generate a table of sunrise
and sunset times for that location and that year. Another option will produce
similar data for moonrise and moonset. So, if you don't like our choice
of location or year, feel free to replace our data with data of your choice.
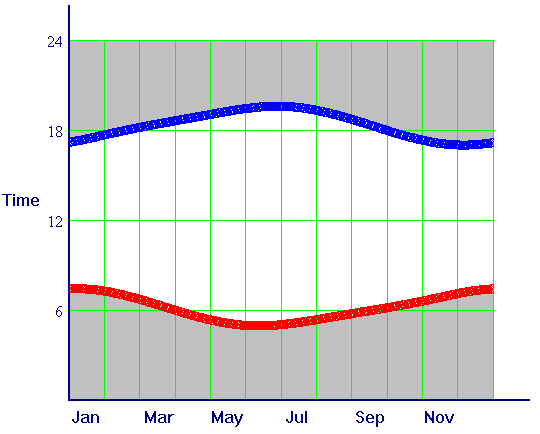
In the figure below, we
show graphically the USNO data for sunrise and sunset for the 365 days
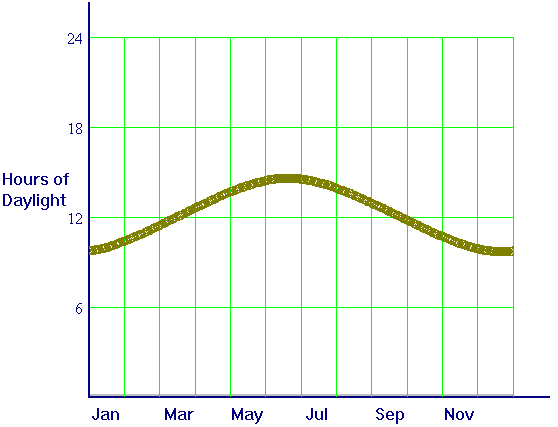
of 1997 at Durham, NC. From these data, we may compute hours of sunlight
in Durham (where the sun always shines, of course). We show the computed
graph of daylight hours in the second figure below.


The following questions
are observation and thought questions. They don't require
any computation beyond visual estimates. (Computation comes in the next
part.) We will refer to the two curves in the first figure as sunrise
and sunset, and to the curve in the second figure as daylight.
- How is the daylight
curve computed from the sunrise and sunset curves?
- Which one(s) of the three
curves appear to be sinusoidal, that is, to have the shape of a
sine curve? For any that does not look sinusoidal, describe the way in
which it fails to be sinusoidal.
- What days do you expect
to be the shortest and longest (in the sense of hours of daylight)? Are
these the days of earliest and latest sunrise and sunset? Explain.
- Estimate the length of
the longest day. Of the shortest day.
- Estimate the average
number of hours of daylight over the entire year.
- Estimate the period
of the daylight curve. In what way(s) would you expect a daylight
curve for 1996 or 1998 to differ from that for 1997?
- Where would you place an
origin (0,0) in the date-daylight plane to make it as simple as
possible to fit a sine curve to the data? That is, what date and what number
of hours of daylight would give the most convenient starting point for
your fitted function? Explain your answer.
- If we leave the origin
and scale where they are -- 0 date on January 1, with time measured
in days or months (your choice), and daylight measured in hours from 0
-- we are likely to find a sinusoidal function of the form
h(t) = A + B sin [ C (t - t0)].
Explain how A, B, C, and t0 are
related (in some order) to the lengths of longest and shortest days, the
average length over a year, the period, and your choice of where to put
the origin.
- Use your answers to steps
4 through 7 to estimate the coefficients in step 8. That is, write a specific
sinusoidal function that you think will match the data.
In a later part of the module,
we will see that long-term average temperature data for a given location
also tends to have a sinusoidal pattern.
Send comments to the
authors <modules at math.duke.edu>
Last modified: October 28,
1997

