|
|
|
|
|
|
Part 3: Parameter Values
We turn now to the question of appropriate values for the parameters 20 years after Keller's work. The following tables record 1993 world-class performances in the 100 meter sprint, separately for men and women. Each table shows "split times" for 30, 60, 80, and 100 meters.
| Name | 30 m | 60 m | 80 m | 100 m |
| Linford Christie | 3.85 | 6.45 | 8.15 | 9.87 |
| Andre Cason | 3.83 | 6.43 | 8.15 | 9.92 |
| Dennis Mitchell | 3.82 | 6.46 | 8.22 | 9.99 |
| Carl Lewis | 3.95 | 6.59 | 8.30 | 10.02 |
| Name | 30 m | 60 m | 80 m | 100 m |
| Gail Devers | 4.09 | 6.95 | 8.86 | 10.82 |
| Merlene Ottey | 4.13 | 6.98 | 8.87 | 10.82 |
| Gwen Torrence | 4.14 | 7.00 | 8.92 | 10.89 |
| Irina Privalova | 4.09 | 7.00 | 8.96 | 10.96 |
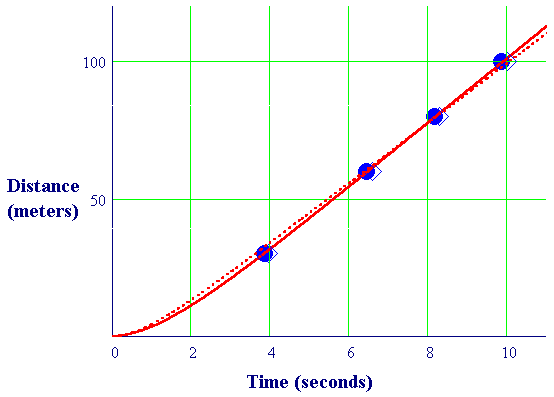
To illustrate the meanings of split times -- and the possibility that Keller's parameters are outdated -- we show the men's split times in the following figure, along with possible model distance functions. Christie's data (fastest) are shown as solid circles, and Lewis's (slowest) as open diamonds. The broken curve shows the distance function you calculated in Part 2 with Keller's parameters. The solid curve shows a possibly better fit -- with a faster terminal velocity.


|
|
|
| modules at math.duke.edu | Copyright CCP and the author(s), 1998 |