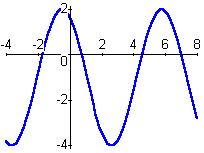
- The amplitude of a sinusoidal wave is defined to be half of
the distance from the high point of the graph to the low point. For
instance, the sinusoidal graph below has a high point at 2 and a low point at
-4, so its amplitude is 3. (There are 6 units between 2 and -4,
and half of 6 is 3.) Determine the amplitude of each of the sinusoidal graphs
you plotted in Part 1.

- Now plot the graph of B sin(t), defined in your worksheet. What is its amplitude? Change the value of B, plot the new graph, and determine the new amplitude. State the relationship between B and
the amplitude.
- Does changing the value of B have any effect on the period of the function?
- Enter appropriate values of B and C so that the function B sin(Ct) has amplitude 3 and
period of pi/2. What would your B and C values be for an amplitude of 0.5 and a period of 3 pi? Check to be sure.
