I. The metapopulation model takes place on {1,2,...,N}, and evolves as follows:
(i) The particle at x dies, i.e., becomes 0, at rate zt(x).
(ii) Each site gives birth at rate 1 to an offspring of the same type.
(iii) An offspring born at x is sent to a site y chosen at random from the grid.
(iv) If zt(x) > zt(y) then the value at y changes to zt(x)
(v) Each site mutates at rate u to a type chosen uniformly from [0,1].
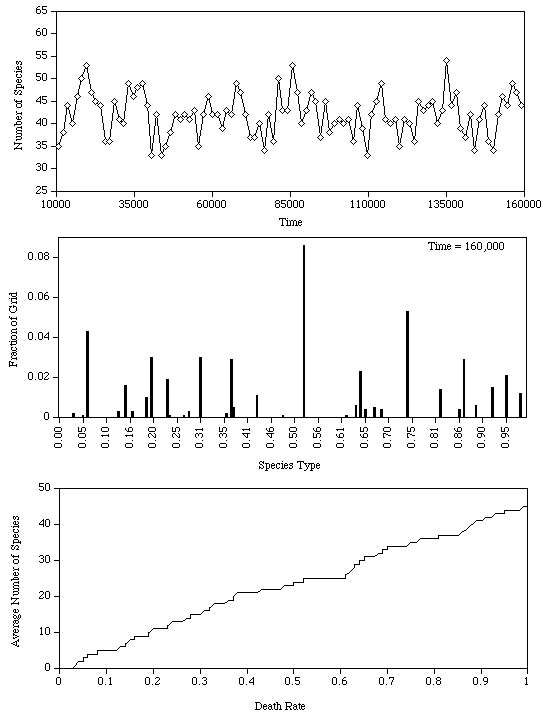
The next figure shows a simulation of the metapopulation model with 160,000 sites. The first panel shows the number of species versus time confirming that we have reached equilibrium. The second panel shows the state at the final time. Note that there is no species packing near 1. The third panel plots the cumulative number of species versus death rate. For example the number above 0.5 shows the number of species with death rate at most 0.5 averaged from time 10,000 to 160,000. Note that the curve is almost linear suggesting that in the long run the species are distributed uniformly in the interval.
