Population Growth Models
Part 5.4: Maine Lobsters: Catch and Traps
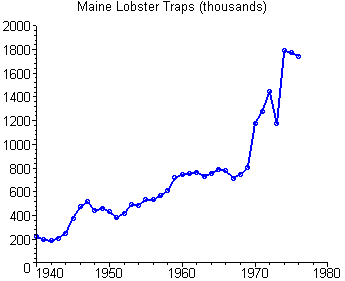
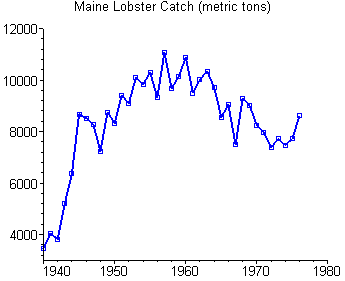
The data from which we will try to determine our model parameters K, r, Q, E, and P0 are the annual lobster catch (in metric tons) and traps in use (in thousands) for the Maine coast. If our time scale is measured in years, then the catch for one year is numerically the same as the catch rate H (in metric tons per year) for that year. The number of traps will be used in part 5.5 to construct a measure of effort E.
We will use these data for the years 1940 through 1976. More recent data are inappropriate for use in the same model because of major changes both in lobster fishing regulation and in lobstering gear (introduction of metal traps) that took place in the mid seventies.
The actual data are given in your worksheet for the calculations in part 5.5. Here we show graphs of the traps data and of the catch data as functions of time:


- What tentative conclusions might you draw from the graphs of the traps and catch data? In particular, do you see any evidence for concern about possible overfishing of the lobster population?

