|
|
|
|
|
|
The simplest way to measure lobstering effort would be to use the number of traps as a proxy for effort. However, when large numbers of traps are in use, there is a diminished return per trap -- as well as a probable reduction in the average number of days per year each trap is used. For these reasons, we model the effort as a function of the number of traps, but with a modeling function
such that
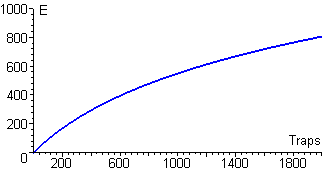
These three conditions assure that the graph of Effort (Traps) starts out tangent to the graph of Effort = Traps, but then bends down and away from that line. There are many such functions -- the one we choose to use is

Here is the graph of this function:

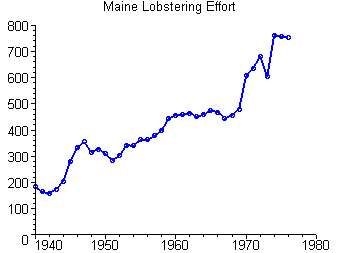
When we apply the Effort function to the data on number of traps in use, we get the following scatter plot. (Note that Effort is expressed in arbitrary units.)

|
|
|
| modules at math.duke.edu | Copyright CCP and the author(s), 1999 |