Population Growth Models
Part 5.6: The Equilibrium Catch-Effort Curve:
Biological Overfishing?
In Part 5.5, we derived a set of "model data" for lobstering effort E, based on actual data for number of traps in use. In Part 5.4, we observed that the lobster catch in a given year is numerically the same as the catch rate H in metric tons per year.
Let us assume now that the lobster population is at equilibrium under the harvesting pressure. In Part 5.2, you showed -- given this equilibrium state -- that the ratio H / E should be a linear function of E with slope - Q2 / r and intercept QK. Recall that
- K is the environmentally supportable population in the absence of harvesting,
- Q is the catchability quotient, presumably a constant characteristic of lobsters, and
- rK is the natural (proportional) growth rate in the absence of both harvesting and crowding.
Now that we have data for H and E, we can examine whether the model is a reasonable fit to reality, and -- if so -- we can attempt to estimate the parameters. In the following figure, we show a plot of the 36-year data for H / E versus E, along with a "best-fitting" (least squares) line. The roughly linear distribution of the data confirms the reasonableness of using this model, and the slope and intercept of the line may give us a way to estimate parameters.
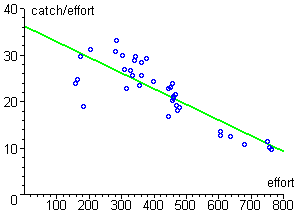
- Make your own plot of Catch/Effort versus Effort. Add to this plot the least-squares line. Determine the slope and intercept of the line.
- Use the relationship intercept = QK to express the catchability quotient Q as a function of the environmental carrying capacity K.
- Use the relationship slope = - Q2 / r to express r as a function of K.
To complete the job of parameter estimation, we need a way to estimate the environmental carrying capacity K. We will return to this issue in Part 5.8.
- From the linear relationship between H / E and E, find a formula for the equilibrium catch H as a function of effort E. Plot this relationship.
- Add to your plot a scatter plot of the catch data vs. the effort data. Does your equilibrium catch-effort curve give a reasonable approximation to the actual data?
- The Maximum Sustainable Yield (MSY) is defined to be the maximum catch obtained at equilibrium. The corresponding effort is denoted EMSY. What is your value for EMSY? How many traps per year does this effort translate into? (Recall that the relationship between traps and effort was modeled in Part 5.5.)
- Biological overfishing is said to occur whenever the effort exceeds that needed to maintain MSY. According to your model, has biological overfishing occurred in the Maine lobster industry? If so, in what years? Should this result be of concern to Maine lobstermen?