Distributions of Data
Part 3: Working with Data
In this part we discuss methods of displaying and describing a given set of data. We will experiment with a data set consisting of the heights in inches of one-hundred women. You will find a list of these heights in your worksheet.
- What can you determine about these heights by examining the individual data values?
Although you obtained some sort of "feel" for the data in step 1, with such a large set we would rather have a graphical way of representing the data. The simplest is the scatter plot -- a plot of the points (n, valuen) for all n, in our case, a plot of (n, heightn) for n = 1 .. 100.
- Construct a scatter plot of the height data. What do you learn about the data from this representation?
You may still not be clear about the way this data is distributed. For example, are you more likely to find a random data value from this set near 62 inches or 64 inches? In order to obtain a better understanding of the way this data is distributed, we may use any of a variety of histograms.
The type of histogram we will use is constructed in the following manner:
- Pick a positive integer n.
- Divide the range of the data, i.e, the interval from the smallest data value to the largest data value, up into n subintervals so that each subinterval contains (approximately) the same number of data values.
- Construct over each subinterval a rectangle such that the area of that subrectangle is the same as the fraction of data values in the subinterval. For example, if a given subinterval contained 1/3 of the data values, then the area of the corresponding rectangle would be 1/3.
Here is an example of such a histogram for the set of height values. In this case, there are 8 subintervals.
Histogram of Height Data

- Use your worksheet to construct histograms for the height data using a range of values of n, the number of subintervals. What happens when the number of subintervals is small? What happens when the number is large?
In addition to graphical representations of data, we will use several numbers as descriptors of a data set. The first of these is the average or mean of the data. For a set Data of N data values Data1, Data2, ..., DataN,

- Calculate the mean for the height data. Is this what you would have expected from the histogram representations?
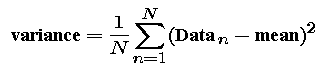
The mean describes the "center" of the data. Next we want a measure of the spread of the data about the center. We will do this in two steps. First we define the variance of the data -- the average of the square of the difference between the data values and the mean.
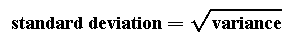
We would like to have our measure of spread have units of distance; however, the variance has units of distance squared. So, we will usually work with the square root of the variance -- called the standard deviation.
- Calculate the standard deviation for the height data. For the height data, what is the fraction of the data values lying between the mean minus the standard deviation and the mean plus the standard deviation?
Notation: It will be awkward to write out "mean" and "standard deviation" in each calculation that we do. The usual shorthand for these quantities is to use the Greek letter  for the mean and the Greek letter
  for the standard deviation.
Given the data set Data, often we will find it convenient to standardize the data
set. The standardized data set is a new set of data values obtained from the original set in two steps.
- First, subtract the mean from each data value.
- Second, divide each of the new values by the standard deviation.
The result is a new data set StandardData with again N data values. The nth data value is

- Construct the standardized data set for the height data, and show that the mean of this new data set is 0 and the standard deviation is 1.
- The fact that the mean of the standardized height data was 0 and the standard deviation was 1 had nothing particular to do with the given data. Show that for any data set the mean of the corresponding standardized data is 0 and the standard deviation is 1.