Distributions of Data
Part 4: Normal Distributions
So far we have considered three models of continuous distributions of data -- exponential distributions, the Cauchy distribution, and uniform distributions. In this part we consider another class of models -- normal distributions. These are arguably the most important of all the models; normal distributions are used to model variations in measurable characteristics of a given population -- e.g., height or weight. Also, it is usually assumed that scores on standardized tests such as IQ tests and the SAT are distributed normally.
There is a different normal distribution for each choice of mean and standard deviation. For example, the standard normal distribution models a data set with a mean of 0 and a standard deviation of 1. It is most easily described by its density function, the standard normal density function. The graph of this function is the famous "bell-shaped" curve.
Graph of the Standard Normal Density Function

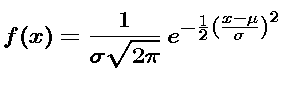
The symbolic description of the standard normal density function is
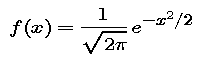
The 2 in the exponent of the formula is a matter of convenience. However, the factor out in front is esential.
-
Use your computer algebra system to calculate the integral
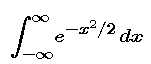 .
.
What is the reason for the factor multiplying the exponential in the formula for the standard normal density function?
We know that the corresponding standard normal distribution function F is given by
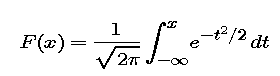
This integral cannot be described in terms of the more common functions -- rational functions, trigonometric functions, exponentials, logarithms, etc.
- Use your computer algebra system to evaluate the integral for F symbolically. The result should be given in terms of the error function (erf).
- Use your computer algebra system to show that
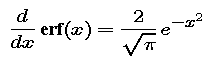
and erf(0) = 0. Use these facts to conclude that
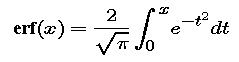
So the error function (and also the standard normal distribution function) is comparable to the trigonometric functions, exponential, and logarithms in that your computer algebra system can calculate values for this function whenever they are needed. However, for the moment, we will return our attention to the density function.
We assert that the standard normal distribution does a good job of modeling the standardized height data. One way to check is to see how closely the density function and histograms of the data agree. Here is a histogram with the density function superimposed.
Comparison of Histogram and Standard Normal Density Function
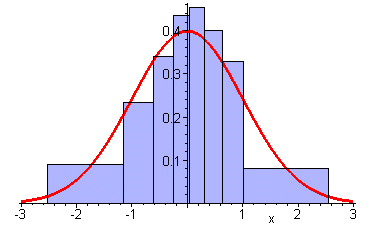
- In what sense should the histogram and the graph agree if this is a reasonable model? Why should there be this agreement?
- Compare several histograms of the standardized height data with the standard normal density function. How well do they agree? Do you think that this distribution is a good model for the data?
Recall that standardized data is obtained by replacing each data value by the result of subtracting the mean and dividing by the standard deviation. The formula for the normal density function corresponding to mean  and standard deviation
  includes the same steps:
- Graph normal density and distribution functions for a variety of means and standard deviations. Now let and be the mean and standard deviation for the original height data. Compare the corresponding normal density function with histograms for the original height data.
What the calculation in step 4 means is that a data set may be modeled by a normal distribution exactly when the corresponding standardized data set is modeled by the standard normal distribution. Indeed, the connection is even closer.
- Suppose Data is a data set which is normally distributed with mean and standard deviation . Let a and b be real numbers such that a is less than b. Show that the probability of a random data value from Data lying between a and b is the same as the probability that a random data value from a set that has a standard normal distribution lies between (a - )/ and (b - )/. In particular, this probability is
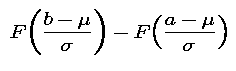 where F is the standard normal distribution function.
- Show that for any normally distributed data set, the probability of a random data value lying within one standard deviation of the mean (i.e., between - and + ) is the same. What is this value?
- What is the probability of a random data value in a normally distributed set lying within two standard deviations of the mean? within three standard deviations?
- In step 5 of Part 3 you calculated the fraction of height values lying within one standard deviation of the mean. How does this compare with your calculation in step 8 of this part? Does this support the assertion that the height data are normally distributed?