and we suppose
 for some c > 0.
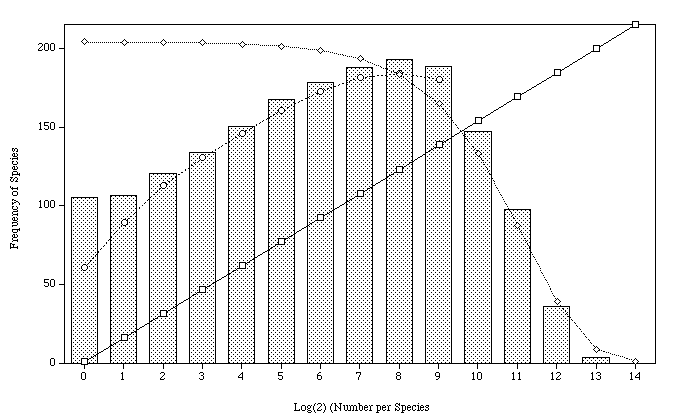
To begin to explain the lines on the graph
we recall that Sawyer (1979) showed
the size of the opinion at the origin O divided by its mean
converges to an exponential distribution with mean 1. Picking the
opinion containing O gives k opportunities for
a cluster of size k.
Removing this size bias from Sawyer's result leads easily to a
result for N(i,j), the number of types with sizes in [i,j).
Here and in what follows

and we suppose
 for some c > 0.
Keeping to the numbering in our papers we now state:
Theorem 3. For any 0 < u < v

The curve of triangles shows the predictions for this result
which fit the data closely for cells 8 and above.